This is the second of two articles on how the economy could affect this year’s presidential election. In part one we looked at how the economy behaved in the terms of each president since Harry Truman, and if and how a president can improve the economy.
To recap, the economy does vary from president to president and term to term. Generally, the economy has been strongest in a president’s second term and generally it’s been stronger under Democratic presidents.
As compared to their predecessors, our likely 2024 candidates presided over economies that were middling, with Biden’s score [through three years] higher than Trump’s.
As to whether the president can improve the economy, they certainly try, and some have been able to help their re-election chances by doing so. In most cases, presidents need support in congress to pass policies that generally have influence on the economy. Even when they do, the impacts are generally small and not quick enough to affect election outcomes.
This article will look at how our economy and our view of it could affect the 2024 election. First, we will review how the public views the economy. We’ll see what they’re thinking and whether they know what they’re doing. We will conclude with forecasts of the election based on what we know about both the objective and the subjective economy.
How are the voters feeling about the economy?
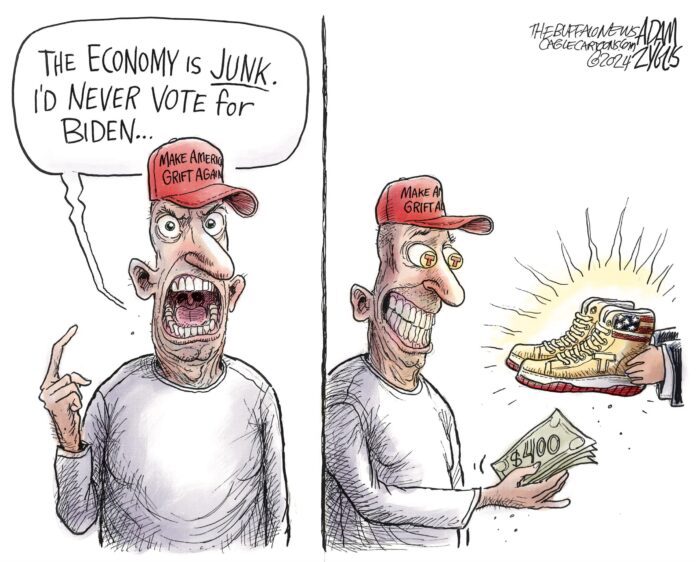
Badly. We hate it. Gallup’s Economic Confidence Index is -32 [0 is how we felt in 1996 when the index began], about the same as during the beginning of the Covid pandemic, and the lowest in nearly 30 years except for the great recession. It’s fallen from -21 at the beginning of the Biden presidency and +23 at the beginning of Trump’s. About a third of respondents think the economy is the most important issue right now. Only 22% think the economy is excellent or good right now and only 28% think it’s getting better.
However, 57% think this is a good time to look for a job. That’s the highest percentage this century, except for the first three years of the Trump administration and the year of recovery from the pandemic.
The University of Michigan Surveys of Consumers have been published longer than the Gallup index, back to 1952, but its story is similar to Gallup’s. The most recent result was 61.3 [the baseline is 100, which was the average in 1966]. Unlike the Gallup index, though, this one is on a slight upward trend. Last summer during the highest inflation it stood at 50.0. Both are well below the 79.0 when Trump handed off [OK, when people wrested the baton from Trump’s greedy dirty little hands] to Biden.
Still, things don’t look good for Biden when we compare consumer sentiment in his term to many of his predecessors. The 61.3 consumer confidence rating under Biden is lower than it was approaching any presidential election except for Obama-McCain election in the depths of the recession. Consumer confidence was higher for all three presidents who lost their re-election bids, Carter [75.0], G.H.W. Bush [73.3], and Trump [81.8]. The lowest consumer confidence for a president that was re-elected was Obama’s [82.6].
Do voters know what we’re talking about?
Well, there’s reason to question us in some ways. Total economic output per person [real GDP per capita] is growing at a healthy rate and is almost back to the pre-pandemic trend. Our economy is growing faster than those of Europe, Canada, and Japan. We’ve even overtaken China’s growth rate for the first time this century. We seem to have escaped the recession that many experts predicted for 2023. The unemployment rate has inched up a bit, but it’s still near the pre-pandemic low under Trump and, except for that, lower than it has been since 1969! Similarly, the federal deficit, while still sizeable, is dropping toward the pre-pandemic level as well.
So why are we unhappy about the world’s strongest economy, and one that’s doing better than it has for most of the last four decades?
It’s because most of us see ourselves as worse off due to higher prices and a slowdown in wage growth. That means our buying power is declining. And it’s hitting everyone, regardless of gender, marital status, or how many hours we work.
That’s likely because housing is one of the areas most affected. Rents are up 25% percent since Biden was inaugurated, and we hit a historic low in affordability of houses. The price of new cars is up 20% from 2020. And while inflation is going down, that just means prices are rising slower. We won’t see 2020 prices again unless there’s a near-collapse of the economy.
We can argue about how much of all of this is Biden’s fault, but it happened on his watch and many of us will hold him accountable. Recent research also suggests that more negative news coverage could be pushing consumer confidence down.
Finally, we’ve always seen reality through the sometimes distorting lens of our political identity. If anything, party identification seems to be more important in our view of everything else than ever. Since there’s a Democrat in the White House, Democrats are more than three times as likely as Republicans to rate the economy as “good.”
Over the long run, though, regular people are very good at judging the economy. In part one I created an index of the economy’s performance for every presidential term since 1948. In that time, the University of Michigan consumer sentiment index has been closely correlated with the overall index that includes economic growth, stock prices, the federal deficit, unemployment, inflation, and inflation-adjusted wages. It’s even more closely related to the personal index that just includes the last three items, which reach the household level. These correlations [.62 and .64 respectively] are extremely high given the small number of elections; in fact, they are so high that there’s about a one percent chance the relationship is random. So yes, the voters do see that economy clearly.
What role will the economy have in the election?
Before we answer that question, let’s look at why the economy may not be a big issue in the 2024 presidential election. It’s never the only and rarely the most important factor. Domestic policy, foreign affairs, the candidates themselves, the partisan split of voters, and turnout all make a difference. Whether the president is an incumbent and how long his party has been in power are important in our thinking, too.
This election could be even less economy-centered since it is unusual in many ways. It features an apparently inevitable matchup between two candidates who are among the political figures in recent American history. Both are very old to be presidential candidates; chances are decent one or both will die or be incapacitated before the 2028 election, and perhaps before this November’s election. Both are arguing that the other guy will destroy America if elected. If the economy calms down and continues to be generally favorable, other issues, like Ukraine, Israel/Palestine, and immigration may eclipse the economy in voters’ minds.
However, the economy does affect presidential elections. To determine how much and in which direction the economy could change this year’s election, I will describe a number of models that relate economic, candidate, and party impacts on elections back to 1952, then use them to predict the election results. [Spoiler alert: they don’t all agree!] My models all estimate the percentage of electoral votes the party in power will get in the next election. Most analysts look at the popular vote, but that’s not a perfect indicator of who will win, thanks to the Electoral College. Biden is very likely to win the popular vote, but the Electoral College gives outsized power to small states that normally vote Republican, so Democrats have won the popular vote seven of the last eight elections, but only won the presidency in five of those elections.
Explaining an election starts with the president and party in power. A model with only incumbency suggests that a president running for re-election is worth about 100 of the 538 electoral votes as compared to an open race. That gives Biden a built-in advantage though that didn’t help Carter, G.H.W. Bush, or Trump enough to keep them in the job. Based on history and considering no other factors, this model predicts a Biden win, however, with a 335-203 electoral vote count.
The length of time a party has held the presidency is a better predictor than incumbency. It explains 30% of the variation in electoral votes [against 13% for incumbency alone]. If the Democrats had been in power for eight years rather than four, they could expect 100 fewer electoral votes, all other things being equal. This model makes things look better yet for Biden, with a 358-179 victory. This forecast is roughly equivalent to the Clinton and Obama reelection victories.
But that leaves 70% of our vote unexplained. Adding economic information into the forecast reduces the unknown about but doesn’t come close to eliminating it. In fact, adding any of the three economic indexes I created to the years the party has held power still only explains 40% of the historical electoral vote count. Like the incumbency and years in power models, all three of the economic indexes also predict a Biden win. The overall index and the headline index [GDP, Stock market, and federal deficit] both suggest comfortable wins [from 391-147 to 435-103] while the personal measure [inflation, unemployment, and wage growth] suggests a very tight win [312-225, much like Biden’s first win].
If you’ve paid attention and are still reading you may think the tight race based on the personal economic index will mean bad news for Biden when we look at the consumer confidence forecast. Well, you’re right. Combining consumer confidence at the end of the presidents’ term with the years his party has been in power is the most powerful forecast, explaining 55% of the variation in electoral votes over the last 70 years. It’s also the only forecast in which Trump wins, by a substantial 362-176 margin. That’s like the margin by which Clinton beat the first Bush.
What does all this mean?
Presidential politics has a rhythm that’s been pretty much in place for a century or longer. But when you assign 150 million people to decide after four years of nasty campaigning, you’re going to make a mess. The rhythm suggests the 2024 election is Biden’s to lose, and it would take some doing to lose it and continued unhappiness with the economy could do the job. To me that looks like the only way Trump can win, but like everyone else, I’ll just have to cringe and see how it all works out.


